Adsorption isotherms
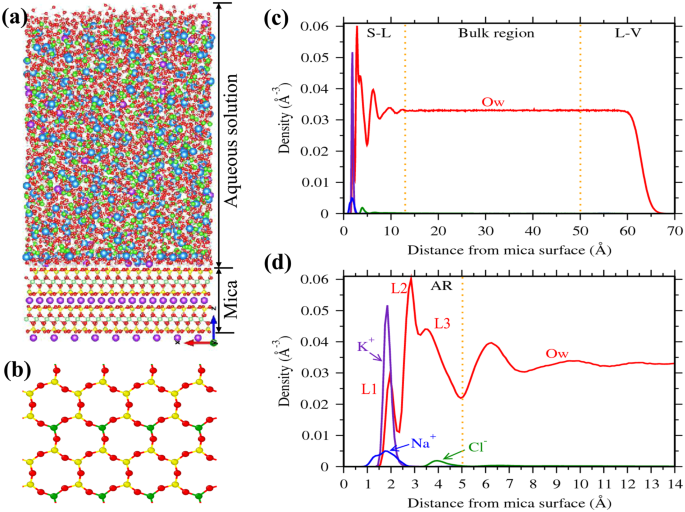
A representative density profile of water and ions adjacent to the mica surface is shown in Fig.
1. The ions are found to be adsorbed mostly around 2–3 Å from the mica surface. These adsorbed ions directly interact with the mica surface by forming a hydration shell with the surface oxygen atoms (Fig.
1a). In case of water molecules, we observed large oscillation in the density profile near the mica surface due to the presence of surface ions (Fig.
1c). The locations and extend of these oscillations are consistent with the experimental studies
28,32, as shown in our previous work
35. Within the 13 Å of the interfacial region, density oscillations are more pronounce between 0–5 Å region (Fig.
1d). Our previous studies have shown that these density oscillations are due to hydration of surface ions by the interfacial water molecules
35,38. In this study, we considered this 0–5 Å region as the adsorption region (AR) and the concentration of ions in this AR (C
A) is considered as adsorbate loading. We further observed that water density in the 13–50 Å region is constant and corresponds to the bulk density of water; the ion concentration within this region is defined as bulk concentration (C
B).
Figure
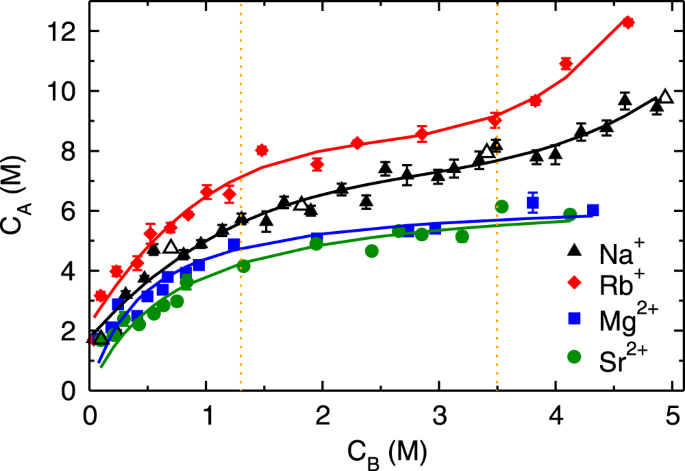
2 shows the adsorption isotherms (C
A vs. C
B) of monovalent (Rb
+and Na
+) and divalent (Mg
2+ and Sr
2+) cations obtained by performing MD simulation of aqueous solutions at various C
B. The adsorption isotherms of both monovalent ions exhibit three regimes; (a) an initial rapid increase for C
B < 1.3 M followed by (b) linear rise between 1.3 ≤ C
B < 3.5 M and (c) subsequent exponential growth beyond C
B ≥ 3.5 M (henceforth referred to as first, second and third regime, respectively). The adsorption quantity of Rb
+ ions is higher compared to Na
+ ions at all C
B, nevertheless, the range of three regimes is similar in both of the monovalent ions. Such characteristic is classified as type-II behavior in the International Union of Pure and Applied Chemistry (IUPAC) classification
41, which is generally attributed to the multilayer adsorption, as observed for water adsorption on mica surface
42. The divalent ions exhibit an early increase in adsorption quantity followed by saturation, which is characterized as type-I behavior in IUPAC classification
41, and attributed to the mono-layer adsorption. The adsorption quantity of divalent ions is lesser as compared to monovalent ions at all C
B, which is a counter-intuitive observation. As the divalent ions have higher charge and hence electrostatic interactions as compared to monovalent ions, we expected their adsorption to be higher than monovalent ions. We also observed that the difference in adsorption behavior of simple and heavy metal ions (Na
+ vs. Rb
+ and Mg
2+ vs. Sr
2+) is non-significant. In order to understand the observed variation in adsorption behavior, we have investigated the energetics and hydration structure of adsorbed ions near the mica surface as described below. We first describe the adsorption behavior of monovalent ions followed by divalent ions.
Free Energy Profile of Adsorbed Ions
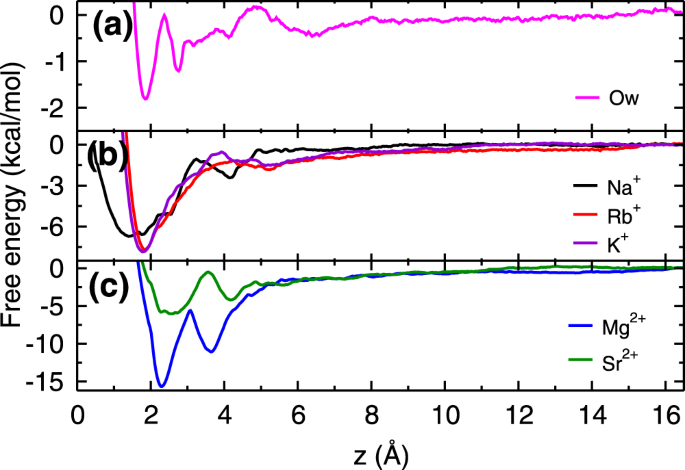
Figure
3 shows free energy profiles of cations (K
+, Na
+, Rb
+, Mg
2+ and Sr
2+) in water adjacent to the mica surface, calculated using the umbrella sampling technique
43,44 and the weighted histogram analysis method
45 (details are given in section 1 of Supplementary Information (SI)). The obtained free energy profiles are qualitatively in good agreement with the previous simulation
40 as well as experimental results
46. The deviations observed in the energetics are due to differences in force-fields and protocol followed (section 1.1 of SI). For the sake of comparison, we have also calculated the free energy profile of a water molecule adjacent to the mica surface. From the free energy profiles, we observed that Rb
+ and K
+ ions have single free energy minimum, whereas Na
+ ion, both divalent ions (Mg
2+ and Sr
2+) and water molecules (Ow) have two minima in the free energy profiles within the AR. The location of these minima and corresponding adsorption strength (Δ
A - the free energy difference between the minimum and bulk region) are listed in the Table
1. The cations and water molecules adsorb at these free energy minima locations as observed in the density profiles (Figs
1c,d and
S1–
S4 of SI).
From the free energy profiles, we found that K
+ and Rb
+ ions have similar adsorption strength, which suggests that their adsorption should be competitive in nature. Further, the adsorption strength of Na
+is weaker as compared to Rb
+, and hence responsible for lesser adsorption of Na
+ ions as compared to Rb
+ ions. The free energy of water molecules adsorbed closer to the surface in the ditrigonal cavity (referred to as L1 water molecules, Fig.
1d) is much lesser as compared to all cations suggesting that adsorption of cations should occur at the expense of these L1 water molecules. As hypothesized, the adsorption strength of divalent Mg
2+ ions is higher than the three monovalent ions. However, in case of Sr
2+ ions, we have observed adsorption strength to be comparable to the monovalent ions. While free energy explains the difference in adsorption loading between monovalent Na
+ vs Rb
+ ions, however, it does not provide the reason for the lesser adsorption loading of divalent ions and different isotherm behavior observed. In order to understand that, we turn towards the detailed structural analysis of adsorbed ions using coverage, ion-hydration number, and cation-anion cluster formation. Also, to illustrate the role of hydration energies, we discuss the adsorption mechanism of Rb
+, Na
+, and divalent (Sr
2+ and Mg
2+) ions which have hydration energies similar, moderately higher and extremely higher compared to competitive surface K
+ ions.
Adsorption Behavior of Monovalent Ions
Mica–RbCl system
Every unit cell of mica surface contains two ditrigonal cavities (Fig.
1b) where cations and water molecules compete to adsorb, and hence taken as adsorption sites in the coverage analysis. In distilled water system (i.e. no salt present), K
+ ions occupy half of the cavities (i.e. fractional coverage,
θK ~ 0.5), and the rest are occupied by L1 water molecules (
θOw ~ 0.5). At the lowest RbCl salt concentration of (C
Rb,B) 0.04 M studied here, Rb
+ and K
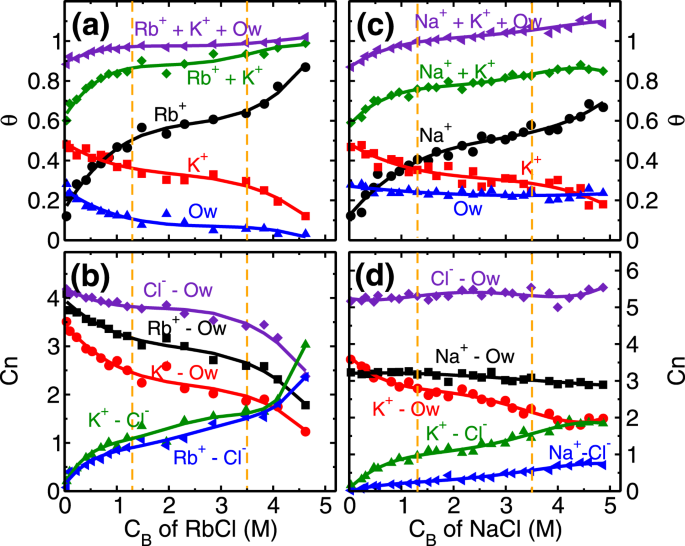
+ ions adsorb on the cavities and respectively occupy around 0.17 and 0.48 fraction of total cavities (Fig.
4a) while coverage of L1 water molecules is decreased to
θOw ~ 0.25. This adsorption of Rb
+ and K
+ ions is driven by their adsorption strength (Δ
A) at the mica surface. Our calculations showed (Fig.
3b) an insignificant difference in their adsorption strength (Δ
ARb ~ Δ
AK), means both of them have an equal chance to occupy an adsorption site. As a result, we observed K
+ ions were able to maintain their fractional coverage (of
θK ~ 0.48) in the presence of Rb
+ ions. Furthermore, lesser adsorption strength of L1 water molecules compared to both, Rb
+ and K
+ cations (Fig.
3a,b and Table
1) leads to their desorption from the surface. In this regime, the adsorption of Rb
+ ions (
θRb = 0.5), occurs at a minimal desorption of K
+ ions (
ΔθK=0.13) and significant desorption of water molecules (
ΔθOw=0.4) highlighting the role of similar hydration energy of Rb
+ and K
+ ions (Table
1). The adsorption of Rb
+ ions in this regime is governed by the attraction from the mica surface.
The next adsorption regime (i.e. 1.3 ≤ C
Rb,B < 3.5 M) corresponds to the transition regime where predominantly the development of RbCl and KCl clusters occur. The total adsorption of (both, K
+ and Rb
+) cations beyond fractional coverage of (
θK +
θRb>) 0.5 creates an overcharge on the mica surface. This surface overcharging is compensated by the adsorption of Cl
− ions observed around 4 Å adjacent to the mica surface (Fig.
S1 of SI). The association of these anions (Cl
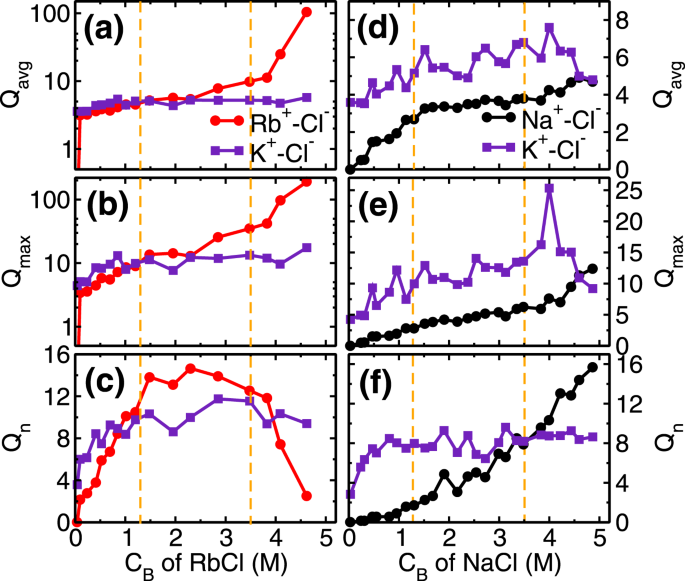
−) with adsorbed cations leads to a formation of salt clusters (i.e. RbCl and KCl) on the mica surface. We analyzed the average (Q
avg), maximum (Q
max) and the total number of clusters (Q
n) formed by ion-pairs in the cluster calculations. Ion-pairs are defined as the combination of the cation-anion pair located within the first minimum of cation-anion pair correlation function (PCF). A collection of such ions forming a network of ion-pairs having a minimum three ions are defined as the cluster (i.e. excluding monomers and dimers). In the first adsorption regime, while the Cl
− ions do associate with Rb
+ ions and form around
Qn≃10clusters (Fig.
5c), nevertheless
Qavg of RbCl and KCl clusters remain around 5 (Fig.
5a). In the second regime, these small clusters are conjoined by the significant adsorption of Cl
− ions, leading to the formation of bigger clusters. During this regime, we observed that
Qavgand
Qmax of RbCl grows from around 5 to 10 and 9 to 35, respectively (Fig.
5a,b). Whereas,
Qavg and
Qmax of KCl remained constant at around 5 and 12 respectively. The association of Cl
− with adsorbed cations is further confirmed by the coordination number analysis (Fig.
4b), where coordination number is defined as the number of anions (or water molecules) present within the first minimum of PCF. We observed an increase in the ion-Cl
− coordination number (
Cion−Cln) and decrease in the ion-water coordination number (
Cion−Own) of both Rb
+ and K
+cations. Since both of these ions have similar hydration energy hence the rate of change of coordination number (i.e. decrease in
Cion−Own and increase in
Cion−Cln) is similar in both of the ions. This suggests that cation hydration energy plays a crucial role. During this regime as well, the adsorption of Rb
+ ions (
θRb = 0.46−0.64) occurs by the desorption of energetically less favorable L1 water molecules
(θOw=0.12−0.06), while the K
+ ions are retained
(θK≃0.3) (Fig.
4a).
The third regime of RbCl adsorption isotherm (i.e. C
Rb,B ≥ 3.5 M) is mainly due to (a) salting out of RbCl near the mica surface and (b) increased concentration (and hence chemical potential) of Rb
+ ions in bulk solution. The salting out behavior is confirmed by the cluster size analysis (Fig.
5a–c), where, the
Qavg and
Qmax of RbCl cluster increased to around 105 and 190 from 10 and 35, respectively(Fig.
5a,b). Due to the formation of the bigger cluster, the
Qn decreased from ~12.5 to 2.5 (Fig.
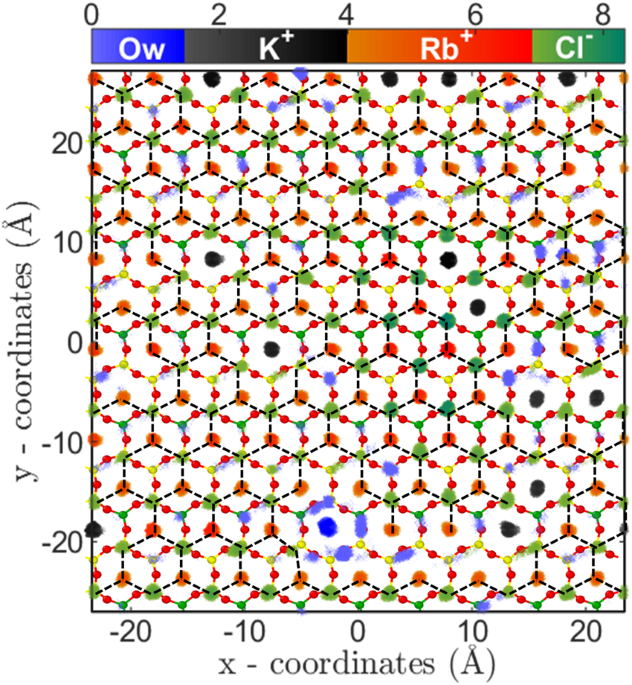
5c). The two-dimensional (2D) density distribution of ions and water present in the AR at C
Rb,B = 4.62 M shows that RbCl salt are arranged in triangular type lattice on the mica surface (Fig.
6). The Rb
+ions adsorbed on the cavities are surrounded by 3 Cl
− ions adsorbed on top of the silicon (Si) atom of mica surface. This is the first computational study which shows surface mediated early salting of RbCl at 4.62 M compared to the salt formation in bulk solution at solubility limit of 7.52 M. Since the number of adsorbed L1 water molecules are minimal, hence the adsorption of Rb
+ ions in this regime (
θRb=0.64−0.87) occurs by the desorption of K
+ ions (
θK = 0.3−0.12). The
Qn,
Qavg and
Qmax of KCl clusters remains constant during this third regime (Fig.
5a–c). In the cluster calculations, the monomer and dimers are not included and the invariant cluster size parameters (
Qavg,
Qmax and
Qn) of KCl cluster at higher concentration indicate that the monomers and dimers of K
+-Cl
− ion-pairs are desorbing in this regime.
In summary, Rb+ ions adsorption on the mica surface in the three regimes is respectively governed by (a) attraction from the mica surface, (b) development of RbCl cluster and (c) salting out behavior at a higher CB. Due to similar hydration energy of Rb+ ions with competing K+ ions, the desorption of K+ ions is slow as compared to less favorable L1 water molecules. The mechanism of Rb+ ions adsorption occurs mainly by the desorption of adsorbed water molecules, and at higher concentration by the desorption of K+ ions from the surface.
Mica–NaCl system
The adsorption behavior of Na
+ ion on mica surface is similar to Rb
+ions, as explained above. Here also we observed three adsorption regime (Fig.
2), with adsorption of Na
+ ions in the first regime governed by the attraction from the surface, and development of NaCl cluster in the later stages (Fig.
5d–f). The main difference is the higher hydration energy of Na
+ ion compared to Rb
+ and K
+ ion (Table
1). Due to this significant difference, we hypothesize that interfacial water should play a crucial role in the adsorption of Na
+ ions here. Indeed we find five noteworthy observations related to interfacial water in Na
+ ions adsorption which are absent in Rb
+ ion case. (a) Retention of L1 water molecules (
θOw) even at higher C
Na,B, (b) total fractional coverage (i.e.
θNa +
θK +
θOw) exceeding 1, (c) higher number of water molecules in the AR in Na
+ system compared to Rb
+ system, (d) constant
CNa−Own at all C
Na,B and (e) absence of significant NaCl cluster. The reasons for these observations are explained below.
In our analysis, we observed that
θOw∼0.23 (L1 water molecules) at all NaCl concentrations studied (Fig.
4c). These L1 water molecules are found in two configurations; either solely adsorbed on the cavities or co-adsorbed with Na
+ ions as part of cations hydration shell (Fig.
S12 of SI). This co-adsorption of water is possible due to smaller hydration shell size (Fig.
S6 of SI) and higher hydration energies of Na
+ ions (Table
1) compared to K
+ and Rb
+ ions. With the increase in concentration, the fraction of water molecules co-adsorbed with Na
+ions increases linearly (Table
S2 of SI). As a result, the total fractional coverage of adsorbed species (i.e.
θNa +
θK +
θOw) exceeds 1.0 at higher concentrations (Fig.
4c).
To understand the constant profile of
CNa−Own, we probed the total number of water molecules in AR. We found that presence of a higher number of water molecules and their redistribution from K
+ to Na
+hydration shell is responsible for this behavior (Figs
S9 and
S10 of SI) which is explained below. Our previous work has shown that, while the majority of the L2 and L3 water molecules (Fig.
1d) hydrate the adsorbed cations (K
+ and Na
+/Rb
+), however a small fraction of free (i.e. non-hydrating) water molecules are also present. The presence of these free water molecules is essential to form a network of hydrogen bonds with all molecules of L2 + L3 layer and especially with L1 water molecules, thus stabilizing L2 and L3 layer
35,38. Since the number of L1 water molecules is significant in Na
+ ions, this leads to the higher fraction of free water molecules of L2 and L3 layer even at higher salt concentration of Na
+ ions as compared to the case of Rb
+ ions (Fig.
S9 of SI). In addition, though the number of K
+ ions and water molecules hydrating them decreases with an increase in
CNa,B, however, the total number of hydrated water molecules (i.e. hydrating Na
+ and K
+ ions) is found to remain constant at all
CNa,B (Table
S2 in SI). This suggests that water molecules are re-distributing from K
+ hydration to Na
+ hydration shell, motivated by their hydration energies (Fig.
S10 of SI).
Since Na
+ ions are preferentially hydrated by water molecules, Cl
− ions adsorb more near the K
+ ions and preferably form KCl cluster as compared to NaCl cluster. This is confirmed in the cluster size analysis where we observe that
Qavg,
Qmax and
Qn of NaCl cluster is less than KCl cluster (Fig.
5d–f). The adsorption of Na
+ ion in the third regime of adsorption isotherm is governed by (a) increased
CNa,B, which forces Na
+ ions to adsorb on the surface, and (b) subsequent desorption of K
+ions. Both of these phenomena is captured in cluster size analysis, where a decrease in KCl cluster size (especially
Qmax), and corresponding increase in
Qavg,
Qmax and
Qn of NaCl cluster is observed(Fig.
5d–f). In the RbCl system, the Rb
+ adsorption in the third regime occurs due to desorption of both water molecules and K
+ ions, whereas here in NaCl system K
+ ions desorption is only the limiting factor. Due to higher hydration energy of Na
+ ions, the water molecules are retained in the hydration shell whereas desorption of K
+ ions occur.
Adsorption Behavior of Divalent Ions
Since divalent ions have higher electrostatic interactions compared to monovalent ions, we expected their adsorption quantity would be higher as compared to monovalent ions. However, we found two remarkable counter-intuitive observations from the adsorption isotherms of divalent ions; (a) low adsorption quantity and (b) early saturation behavior as compared to monovalent ions (Fig.
2). In addition, we observed that adsorption isotherm of both Mg
2+ and Sr
2+ions are similar. Since the divalent ions have higher hydration energy compared to monovalent ions (Table
1), it pointed that the observed behavior could be related to the hydration structure of adsorbed ions. To confirm this point, we investigated the ion-water PCF and 2D density distribution of adsorbed divalent ions near the mica surface. The ion-water PCF clearly shows a strong peak followed by the PCF going to zero indicating that water molecules of hydration shell are tightly bound to cation (Figs
S7 and
S8 of SI). The bulk analysis of these ions indicates that hydration water has higher residence time adjacent to these ions
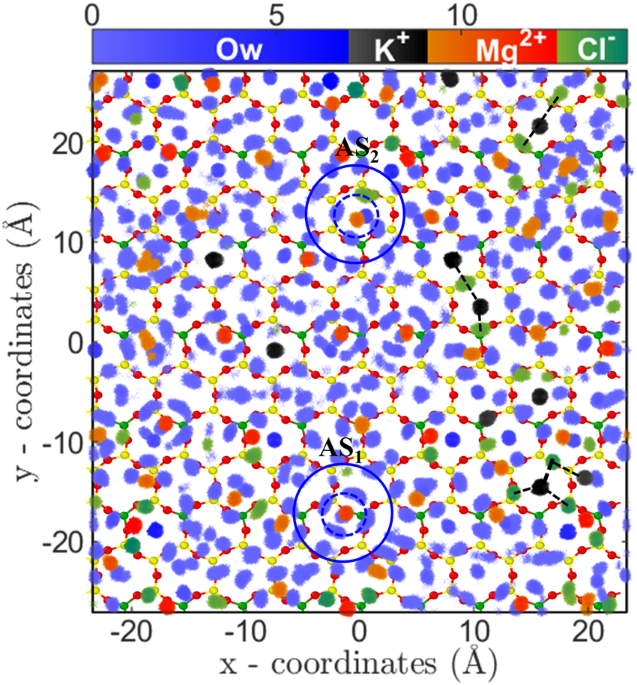
47. This indicates that divalent ions essentially have an effective higher size due to their tightly bound first hydration shell, which reduces the available area for the adsorption of ions. The 2D density distribution analysis also confirms the hypothesis where distinct water density peaks around ions are observed (Fig.
7). Further, the 2D density distribution shows that these ions are adsorbed on the cavities in two different states; near the surface oxygen (AS
1) and at the center of cavity (AS
2) (Figs
7,
S13 and
S14 of SI). The hydrated water molecules are found to adsorb in the nearby hexagonal cavities, which due to steric repulsion prevents adsorption of other cations (i.e., Mg
2+/Sr
2+ and K
+). Due to this arrangement of divalent ions and their hydration water, the total number of hexagonal sites available for adsorption is reduced and hence leads to lesser adsorption and early saturation, as observed. Since both of these ions have comparable hydration energy and hydration structure, hence their adsorption isotherm (i.e. quantity) is also similar at various C
B.
Similar to the monovalent ions, here also we have performed coverage (
θ) and coordination number (C
n) analysis of divalent ions at various C
B. The role of higher hydration energy of divalent ions is very clear in this analysis. In the first regime of adsorption isotherm, (i.e. C
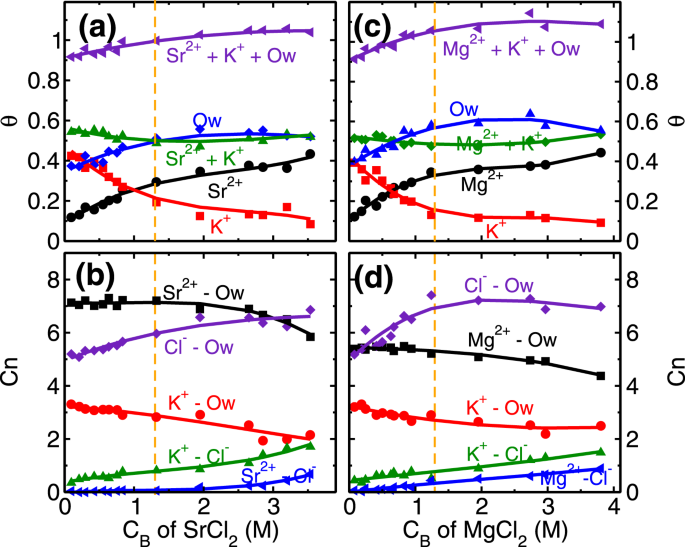
B < 1.3 M) the coverage of both divalent ions increases (Fig.
2). We find that the coverage of L1 water molecules also increases in divalent ions case (Fig.
8a,c) as opposed to decreasing and a constant trend observed in RbCl and NaCl systems (Fig.
4a,c). In the first regime itself, the total coverage of cations and L1 water molecules (i.e.
θM +
θK +
θOw; M = Sr/Mg) reaches 1, with
θOw ~ 0.5 (Fig.
8a,c). From coverage analysis, it is clear that the adsorption of divalent ions in the first regime is governed by the surface attraction hence leads to the rapid rise in coverage. Whereas in the second regime (C
B ≥ 1.3 M), the adsorption occurs by the depletion of K
+ ions. The cluster size analysis also confirms this hypothesis, where we find an insignificant number of M-Cl (where M = Sr/Mg) clusters formation in the first adsorption regime and a minimal number of clusters in the second regime (Fig.
S15 in SI). This indicates that salting out behavior as observed in the RbCl system is not present in the divalent ions case. Again, the ion hydration energy plays a crucial role here. The ions prefer to be surrounded by water molecules (Fig.
7, Figs
S13 and
S14 of SI) as compared to Cl
− ions, hence the increase in coordination number (
CM−Cln,
M = Sr/Mg) is minimal in divalent ions case (Fig.
8b,d).


